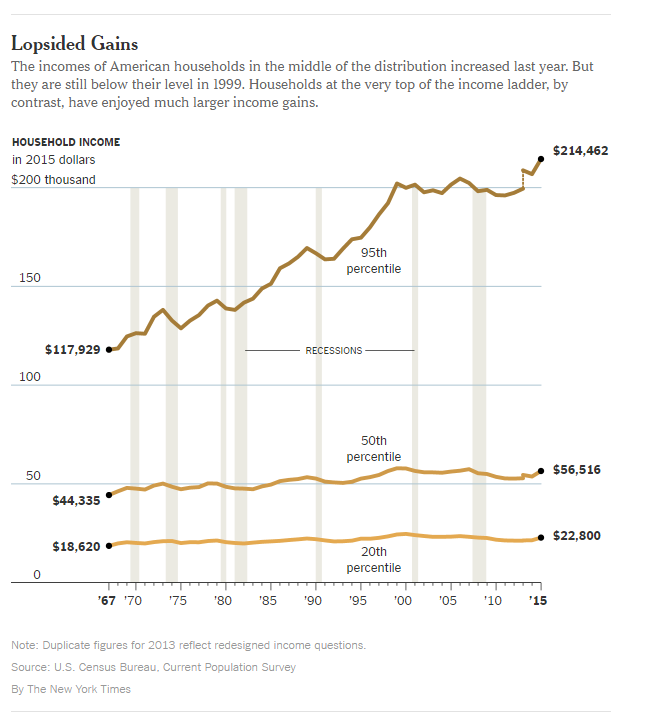
I thought we should finish out 2016 with some good news, and yes I have to reach back to September for this, but America’s middle class (as in the exact middle i.e. 50th percentile) income of $56, 516 did increase by 5.2% in 2015! Which definitely deserves a Wooooohooooo! As this was the first raise since 2007 and the poverty rate dropped from 14.8 percent to 13.5 percent. So why is this blog not titled, “Inequality Better”? The article, America’s Inequality Problem: Real Income Gains are Brief and Hard to Find, does a nice job tempering these positive results with comparisons to other groups and over time:
- This middle income is still 1.6% below the previous peak in 2007 and 2.4% below the absolute peak in 1999 (all measured in 2015$).
- New changes to income data collection actually makes these 4.6% below 2007 peak and 5.4% below 1999.
- In contrast the top 5% saw their income rise 4.9% since 1999 and a whopping 37.5% more than in 1989!
- The bottom 60% of the income distribution are all taking home a smaller slice of the income pie than they did in the 1960’s and 1970’s.
- The bottom fifth of income earners took home 3.4% of the income pie, well off the 5.8% in 1974; while the richest 5% took home 21.8% of the nation’s income.
This was a great article in contrasts and also it highlighted how changing measures (for income and poverty) impact the statistics we collect. A new supplemental poverty measure (see definition of SPM in quiz below) radically changed the distribution of of people by income-to-poverty threshold ratios:
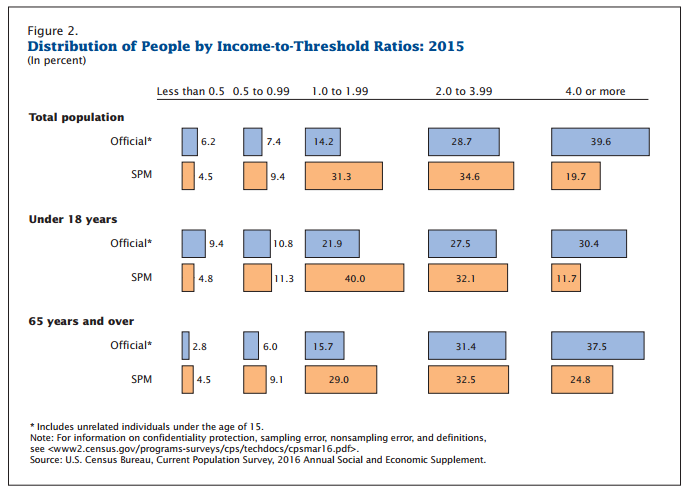
Yes I couldn’t resist this graphic of changing ratios. Try to figure out who is poor based on these ratios :O)
Q5 Income Inequality
Please type answers when possible and leave adequate space for computation work.
- The article, America’s Inequality Problem: Real Income Gains are Brief and Hard to Find[1], contains tons of percentages! It’s like Christmas in %-land.
- The official poverty rate declined to 13.5% from 14.8%. What is the total and percent change in poverty rate?
- The income of the 50th percentile increased a hearty 5.2% to $56,516 in 2015. What was the income in 2014?
- The following chart (1st graphic above) shows household income in 2015 dollars:
- Compute the total change in income for the 3 different percentiles given from 1967 to 2015.
- Compute the percent change for the 3 different groups.
- Compute the average change per year (in $/year and %/year) for the 3 different groups.
- Joel Best in DLS talks about how social problems are patterned. What does it mean to say that poverty is patterned?
- Joel Best in DLS talks about the importance of measurement in creating statistics and how the official poverty measure is out of date. Our article cites a new supplemental poverty measure:
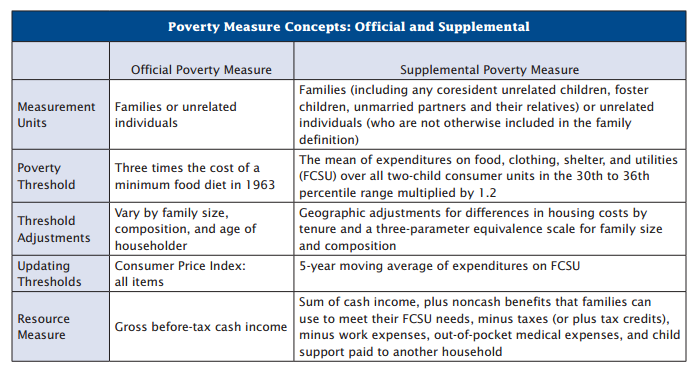

- By including things like housing assistance and food assistance in computing income, and assuming the poverty threshold (the income cutoff below which you are considered poor) stays the same; will this create more false positives or negatives with regard to those in poverty?
[1] http://www.nytimes.com/2016/09/14/business/economy/americas-inequality-problem-real-income-gains-are-brief-and-hard-to-find.html

Eric I am curious about your approach to answering this question, ” By including things like housing assistance and food assistance in computing income, and assuming the poverty threshold (the income cutoff below which you are considered poor) stays the same; will this create more false positives or negatives with regard to those in poverty?
LikeLike
Posted by Ellen Mulqueeny | April 19, 2017, 4:37 pmHi Ellen
My original version of this question didn’t have a clear answer so I am hoping this version does :O) My thought was that if you include assistance as income this would boost your income and could put you over the threshold, and thus not be considered in poverty. So if you make $22,000 and the cutoff for poverty is $24,000, you are “poor”. But if we add in housing assistance and food stamps valued at $3,000 then your income rises to $25,000 and you are no longer “poor”, creating a false negative (not identified in poverty when you are in poverty). The danger is that this would reduce the official number in poverty and could impact funding for such assistance.
LikeLike
Posted by egaze | April 19, 2017, 5:30 pmThanks Eric, this was how I was thinking about it as well, using the definition a false negative and false positives. We (my colleagues) had a spirited discussion on this questions) I am hoping to generate a simialr discussion with my students using this problem before we discussed how to interpret accuracy of medical tests.
LikeLike
Posted by ellen mulqueeny | May 5, 2017, 10:00 pm