thinkingquantitatively
Teaching and Learning Quantitative Reasoning
Thinking Quantitatively Project 10: Phantom Toll Booth
The Maine State Thruway Authority is planning a new entrance/exit and is thinking about the number of tollbooths to construct. Extensive thruway data shows that the average time needed to handle a toll transaction is 15 seconds. Let us suppose that the number of vehicles needing to pass through the tollgate (during peak traffic) follows the probability distribution:
| # Cars Arriving each Minute | |||||
| # Arrivals | 10-20 | 21-25 | 25-29 | 30-33 | 34-45 |
| Probability | 12% | 37% | 33% | 12% | 6% |
Create a spreadsheet which randomly assigns the # cars arriving per minute using the probabilities above, allows you to input a number of tollbooths, and which tracks the back-up of cars over a 1 hour period.
- Fill in the following table (by hand no Excel) assuming there are 6 toll booths constructed. This is VERY IMPORTANT, you must do this paper and pencil exercise first and understand what you are being asked to do before you can hope to create a spreadsheet!
| Minutes | New Arrivals | Total Cars | Departures | Back-up |
| 1 | 21 | 21 | ||
| 2 | 32 | |||
| 3 | 15 | |||
| 4 | 28 |
Your spreadsheet should include:
- Well-labeled cells giving
- the number of toll booths constructed
- and the number of cars your booths can “process” in 1 minute.
- Name both these cells.
- A table turning the probabilities above into cutoffs for use with a VLOOKUP This function will look up a random number in the table and return the number of cars for that minute. Remember how VLOOKUP works, the cutoffs are the left hand endpoints for intervals, your first interval is from 0 to 0.12 (which represents the 12%).
- Columns for Minutes, New Arrivals, Total Cars, Departures, Back-up. Your formulas should link to the named cells from #2 whenever possible.
- Minutes: number of minutes from 0 to 60
- New Arrivals: using probability distribution above and VLOOKUP
- Total Cars: new arrivals + any back-up from previous minute
- Departures: the number of cars departing each minute based on # of tollbooths you construct
- Back-up: cars that did not depart that minute
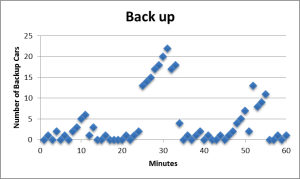
- A scatter-plot showing the back-up for 1 hour.
- Assume each tollbooth will cost $1 million to construct. Each day there are 5 peak hours of traffic, with an average fare of $2.20 per car, and a cost of $45 per booth per hour for the operator.
- Compute the amount of money you can expect to make (fares – operator cost) during 1 peak hour of traffic for the given number of booths.
- Compute how many days it will take to pay off the construction of your tollbooths. Assume during non-peak hours the costs and fares cancel.
- A textbox with your recommendation for the number of tollbooths to construct with explanation. Whatever number you recommend, you must explain why you did not choose the number above and below.


Discussion
No comments yet.